

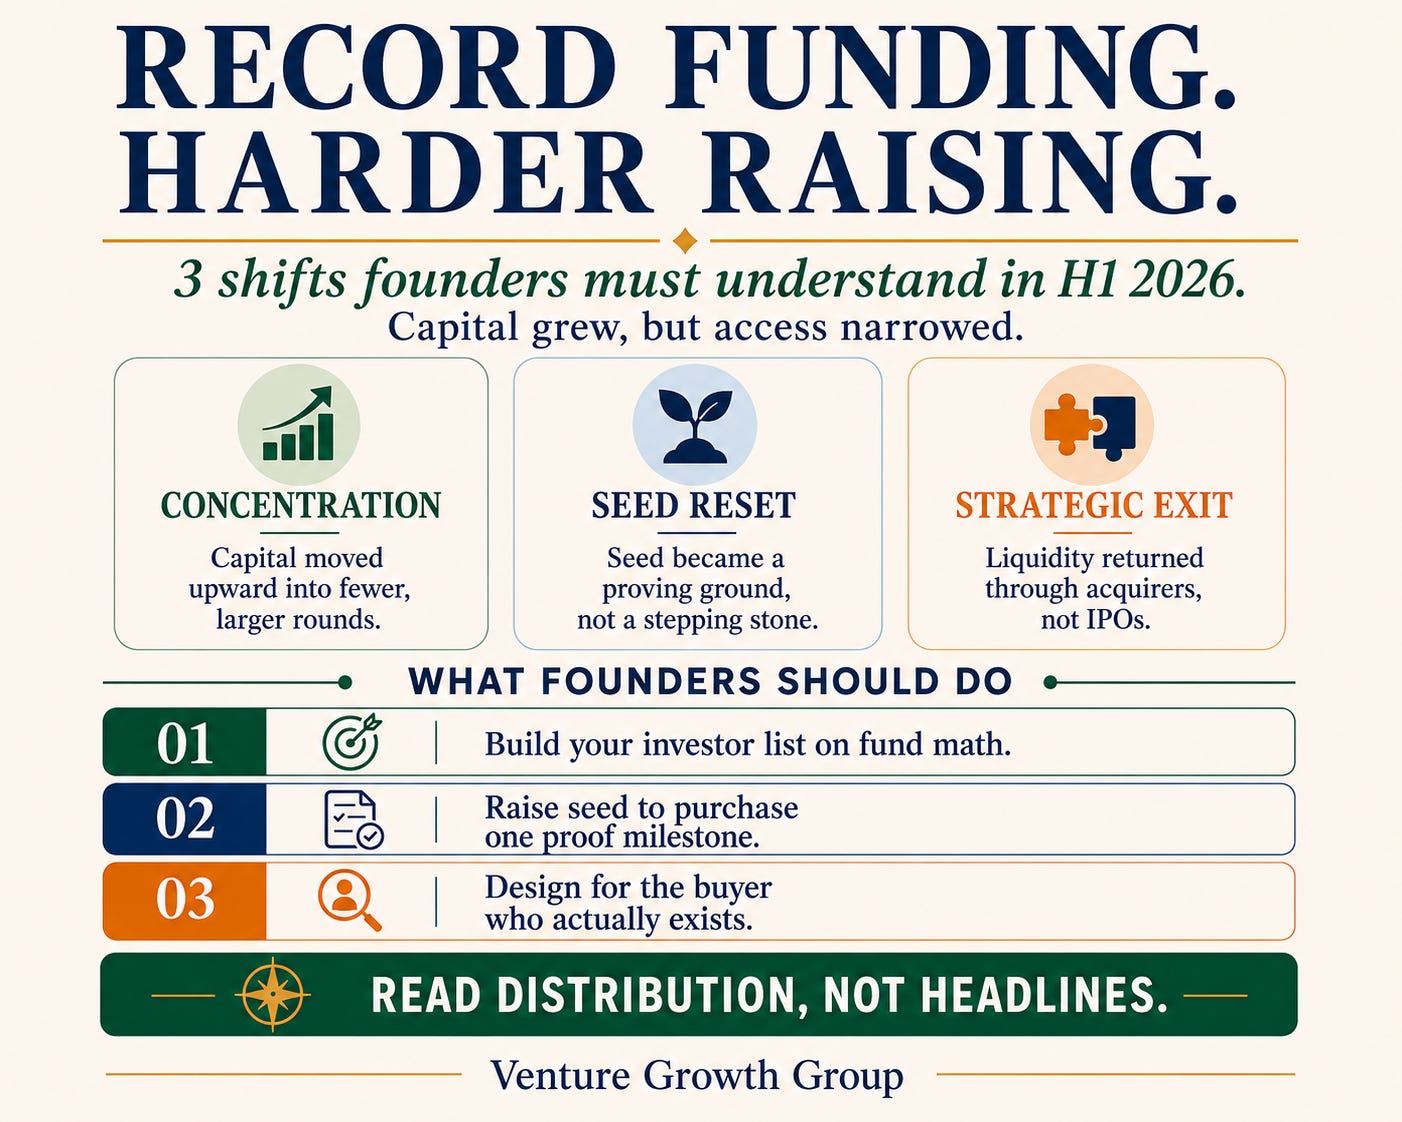
Pattern, Perspective, and Playbook for founders raising in the second half. This report reads the distribution rather than the total, because the total describes a market almost no founder is raising in.
Venture capital just posted the largest six months in its history. Global funding reached approximately $510 billion in the first half of 2026, more than the entire 2025 total in half the time. In the United States, $412.7 billion went out the door, thirty percent above all of last year.
Read the headline, and you conclude money is easy. Read the distribution, and you conclude the opposite.
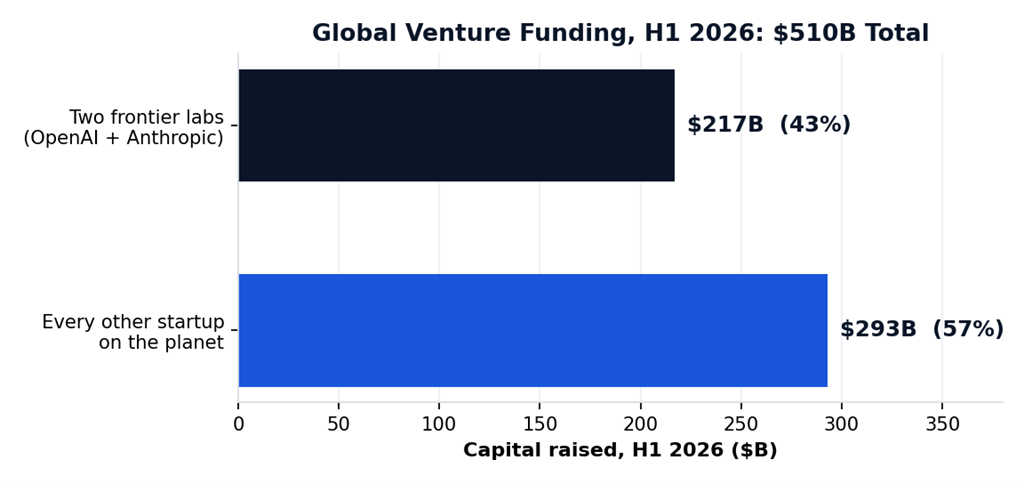
Two companies took forty-three percent of the global total. Ninety-one percent of U.S. dollars went into rounds of $100 million or larger. And sixteen percent of the companies that raised a seed round in 2024 have progressed past it.
The record is real. It is also not your market. Three trends explain the gap between the headline and the room you are pitching in, and each one changes something specific about how you raise between now and December.
The Half in One Sentence
Primary insight: capital hit an all-time high and fundability got harder at the same time, because the money concentrated upward into fewer, larger, later positions while the proof bar underneath that tier rose sharply.
· Global venture funding, H1 2026: approximately $510 billion, above the $440 billion invested across all of 2025 and the largest half-year on record.
· Concentration at the top: OpenAI and Anthropic together accounted for $217 billion, or 43 percent of the global total.
· U.S. deployment: $412.7 billion, 30 percent above full-year 2025. AI accounted for 86 percent of those dollars.
· Round size threshold: 91 percent of U.S. capital went into rounds of $100 million and above.
· Q2 megaround density: 16 companies raised billion-dollar rounds, together $108.6 billion, or 53 percent of the quarter’s global funding.
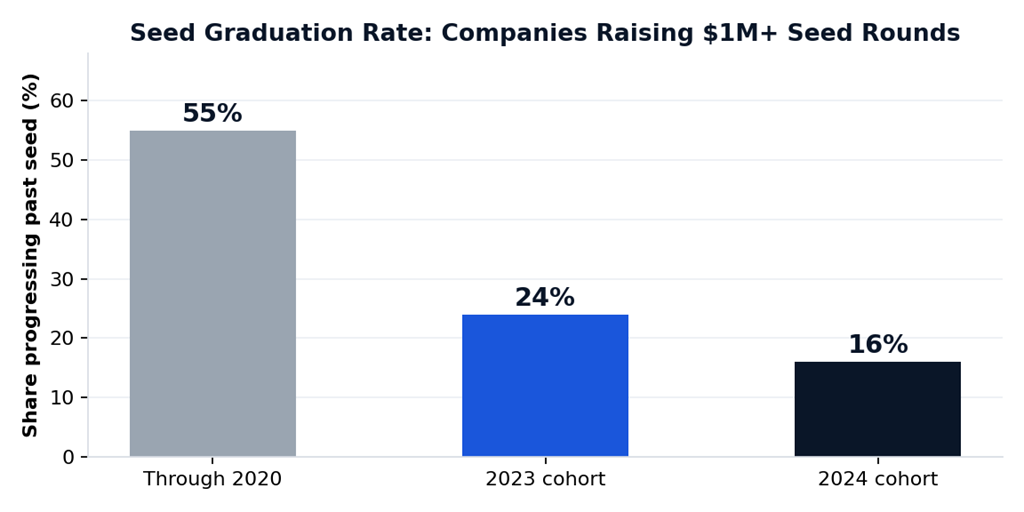
· Seed graduation: 16 percent of the 2024 seed cohort has progressed past seed, against 55 percent or better for every cohort through 2020.
· Liquidity: 32 companies went public above $1 billion in Q2, and 24 were acquired at $1 billion or more, totaling $113 billion, the highest acquisition quarter on record.
Trend 1: Concentration Stopped Being a Cycle and Became the Structure
Pattern
Four separate measurements point the same direction. Two companies took $217 billion of a $510 billion global half. Ninety-one percent of U.S. capital went into rounds of $100 million or larger, and 86 percent of U.S. dollars went to AI deals. In the second quarter, more than 70 percent of global startup capital went to AI-focused companies, up from just under half a year earlier. And the concentration starts upstream of the deals: in the first quarter, the top five managers captured 73.1 percent of all venture commitments, with the top fifteen capturing 88.5 percent. In that same quarter, the five largest financings absorbed almost $200 billion between them, taking the top-five share of total venture deal value above 70 percent, its highest recorded level.
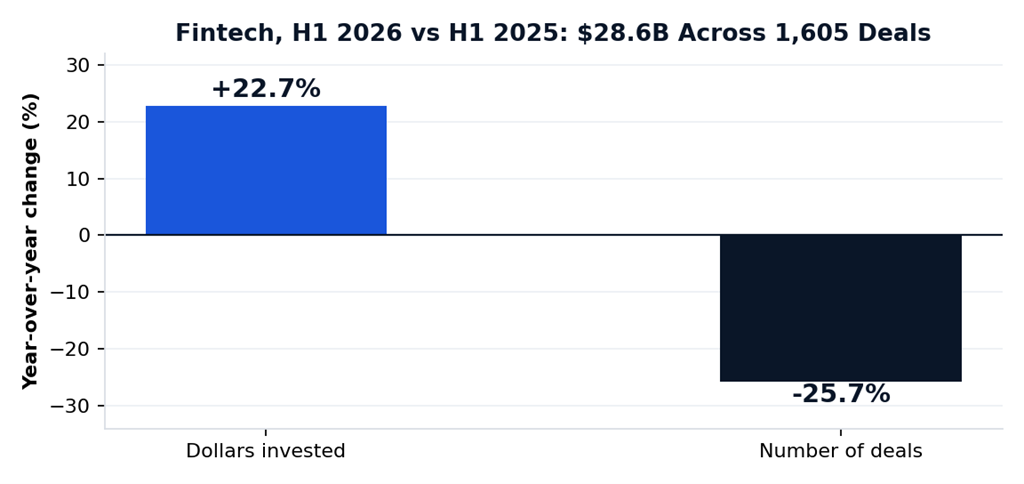
The pattern repeats inside sectors, which is where it stops being an abstraction. Fintech raised $28.6 billion globally in the half, up 22.7 percent year over year, across 1,605 deals, down 25.7 percent. More money, distributed to a quarter fewer companies. Defense tech passed 2025’s full-year record of $9.6 billion inside five months, while deal count ran only slightly ahead of the 2025 pace, driven by a small group of very large rounds at the top of the category.
Perspective
The aggregate is a supply statistic about limited partners and fund sizes. It is not a demand statistic about your round. When a firm closes a $3 billion vehicle, its minimum viable check rises, and positions below that threshold stop being worth partner time regardless of company quality. Capital availability and capital accessibility have decoupled. The dollars are abundant, and they are abundant above you rather than around you.
Founder Blindspot
Founders benchmark against the headline and misdiagnose the result. Record year, so a slow process must be a pitch problem. It usually is not. It is a pool problem. You are pitching funds whose economics no longer permit a round of your size, and no amount of narrative repair fixes an arithmetic mismatch. The most expensive fundraising error in this market is a well-built deck shown to the wrong forty investors.
Playbook
The arithmetic is not subtle once you run it. A $5 billion growth fund targeting a 3x gross multiple needs roughly $15 billion in gross proceeds. A $50 million check that returns 5x produces $250 million, an excellent outcome in isolation and about 1.7 percent of what that fund requires. The partner is not judging your company. The partner is judging whether your company can move their fund.
So rebuild your target list on fund math before you rebuild your deck. For every name, write three facts: the size of their most recent fund, their typical check at your stage, and the last round they led at your stage in your category within the past twelve months. Cut anyone whose fund size divided by expected portfolio positions exceeds your entire round. A $40 million fund writing $2 million checks is a better lead for a $7 million round than a multibillion-dollar platform that would be doing you a favor.
Wrong approach: start with the famous names and work down. Right approach: start with the funds whose check size makes your round their normal deal.
Contrast
In 2021, capital abundance meant capital availability at every stage and every check size. In 2026, abundance is a property of the top tier only, and the tier below it operates under scarcity conditions while reading headlines written about the tier above.
What This Means for Your Raise: The record total does not lower your bar. It raises it, because the same partners now compare your round against the deals absorbing that record.
Trend 2: Seed Stopped Being a Stepping Stone and Became a Proving Ground
Pattern
The median U.S. seed round stood at roughly $3 million in 2025, about triple its 2018 level, with the upper quartile near $5.6 million. Established seed funds describe rounds of $8 million to $10 million as having become routine, and at least one long-standing Bay Area seed firm reports its average check nearly doubling inside eighteen months. Every other number moved against the founder. The time from seed to Series A has stretched beyond two years. Graduation rates collapsed: companies raising $1 million or more at seed through 2020 progressed at 55 percent or better; the 2023 cohort is at 24 percent, and the 2024 cohort is at 16 percent. The revenue threshold moved with it. Seed investors now describe the Series A bar as $2 million to $4 million in recurring revenue, against roughly $1 million a few years ago. That range is practitioner guidance rather than a published dataset, and the graduation data corroborates it rather than proves it. The median U.S. Series A was $15 million in 2025 and has continued to climb into 2026.
Seed is barbelled the same way the rest of the market is. Of the $12 billion in global seed funding in the second quarter, $2.8 billion went to seed rounds of $100 million and up, while $5 billion went to rounds of $10 million and under. The mega-seed and the ordinary seed are now two different products sharing a label.
Perspective
A bigger seed is not a better seed. It is a longer contract with a higher bar. The capital you raise at seed now has to purchase a category of evidence that used to belong to Series A: booked revenue, retained usage, and a workflow you own end to end. Investors did not simply raise the number. They changed the question. It moved from whether this team can build it to whether this has already been bought, repeatedly, by customers who will not stop.
Founder Blindspot
Founders plan runway to the raise instead of to the proof. They budget eighteen months of burn against a Series A that now sits more than twenty-four months out, then spend the final two quarters fundraising with a deck rather than a metric. The failure is arithmetic before it is narrative. By the time the pitch is being blamed, the capital plan has already decided the outcome.
Proof: What Actually Clears Now
In June, XCures closed a $46 million Series B at a $127 million post-money valuation, more than double its December 2023 Series A mark. The company had grown from roughly $3 million to $10 million in annualized recurring revenue during 2025 and reported being on track to pass $20 million in 2026. It had processed more than 300 million medical records drawn from over 550,000 healthcare locations. It had 25 enterprise customers, named ones, including large diagnostics companies. It had reached cash-flow break-even before deliberately choosing to spend again.
That is the shape of the profile clearing outside the megaround tier. Usage density, a revenue curve with two verifiable points on it, a named customer roster, and a demonstrated ability to operate without capital. None of it is a category claim.
Playbook
Build a thirty-month capital plan anchored to a named proof milestone, in three lines.
1. The exact number that clears a Series A in your category. For software, treat the $2 million to $4 million recurring revenue range as a working floor and verify it against three funds that led a Series A in your category this year. For clinical and deep tech, name the readout.
2. The month you reach that number at your current growth rate, not your planned growth rate.
3. The burn required to reach that month, plus a six-month fundraising window on top of it.
If line three exceeds cash on hand, you have a capital planning problem this quarter. You do not have a pitch problem next year.
Wrong approach: raise a seed to buy eighteen months of runway. Right approach: raise a seed to buy one number, and count the months to it before you sign the round.
Contrast
In 2019, a seed round bought eighteen months and a Series A conversation. In 2026, it buys thirty months and roughly a one-in-six chance at that conversation unless the money is converted into deployed proof.
What This Means for Your Raise: Your seed is not bridge financing to a story. It is the budget for the evidence that makes the story unnecessary.
Trend 3: Liquidity Came Back as Acquisition, Not as IPO
Pattern
The second quarter delivered the strongest exit market since 2021. Thirty-two companies went public above $1 billion, and twenty-four were acquired at $1 billion or more, totaling $113 billion, the highest acquisition quarter on record. Through late June, U.S. acquirers had spent at least $119.8 billion buying private venture-backed companies, on pace to exceed 2025’s record.
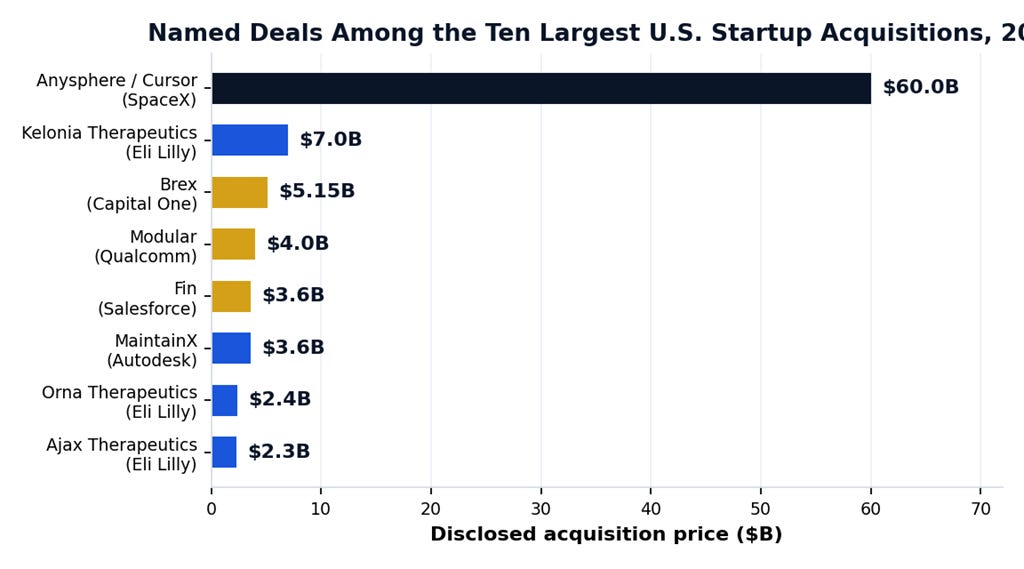
One deal is roughly half of that total. SpaceX acquired Anysphere, maker of the AI coding tool Cursor, for $60 billion, the largest startup acquisition ever recorded and nearly double the prior record, Google’s $32 billion purchase of Wiz. The nine next largest ranged from about $2 billion to $7 billion, and the buyers were operating companies rather than funds. Capital One bought Brex for $5.15 billion. Qualcomm bought Modular for $4 billion. Salesforce bought Fin and Autodesk bought MaintainX for $3.6 billion each. Biotech was heavily represented across the largest transactions, and in most of those the headline figure is a maximum contingent on clinical and commercial milestones, including Eli Lilly’s acquisition of Kelonia Therapeutics at up to $7 billion and its purchases of Orna Therapeutics and Ajax Therapeutics at up to $2.4 billion and $2.3 billion.
The IPO side is more concentrated still. PitchBook put U.S. exit value at roughly $2.2 trillion for the half, and its own U.S. venture research director summarized the distribution plainly: SpaceX accounts for nearly all of it.
Perspective
An exit market that functions only at trillion-dollar scale is not an exit market you can plan against. Look one layer down, and the real path becomes visible. Strategic acquirers with balance sheets are buying capability they have decided not to build. Those buyers underwrite differently from public-market investors. They do not price a growth narrative. They price integration: whether this slots into a product line they already sell, whether it arrives with a customer base they already serve, whether it clears their compliance review, and whether the team stays. The milestone structure running through the biotech deals is that same logic made explicit. Buyers pay for retired risk and withhold payment for risk that is not yet retired.
Founder Blindspot
Founders treat acquisition as a fallback to be designed at the end, usually under pressure and usually too late. Acquirability is built years earlier, in decisions about who owns the data, whether contracts are assignable, how large the integration surface is, and how deep the regulatory position runs. The company that is easy to buy is the company that already owns something the acquirer cannot assemble internally within a year. The error is optimizing architecture for a public listing that will not be available while quietly making yourself expensive and awkward to acquire.
Playbook
Write the one-page acquirer thesis and put it in your data room before an investor asks for it.
· Name the five operating companies, not funds, that would gain most from owning your workflow, your data, or your regulated position.
· For each, name the product line you slot into and the specific capability they cannot build internally inside twelve months.
· For each, name the acquisition they have already made in your category and what it tells you about their price logic.
Then audit your architecture against that list. If the data is not yours, if contracts are not assignable, if the compliance position is thin, you have priced yourself out of the only exit market currently open to companies your size.
Wrong approach: grow toward a listing and treat acquisition as the consolation. Right approach: name the buyer, then build the thing that buyer cannot assemble alone.
Contrast
In 2021, the plan was to grow into a public listing, with acquisition as the fallback. In 2026, the strategic acquirer is the primary path, and the listing is reserved for a small group of companies that will not include most of the market.
What This Means for Your Raise: Your investors are underwriting a path to liquidity, and for nearly every company below the frontier tier that path now runs through a corporate buyer. Name that buyer in your deck before someone across the table asks you who it is.
The Bottom Line
The real insight is not $510 billion. It is that the record and the difficulty are the same fact. Capital concentrated upward into a small number of very large positions, and everything below that tier repriced around evidence rather than narrative. Three rules follow from the half.
Rule 1. Read distribution, not totals.
The aggregate describes limited partner behavior and fund size. Your round is priced by the narrow pool that can still write your check economically. Build the list around fund math, then build the deck.
Rule 2. Fund the proof, not the runway.
Seed capital now buys the evidence a Series A used to grant on faith. Plan thirty months to a named number rather than eighteen months to a conversation.
Rule 3. Design for the buyer who actually exists.
Liquidity returned as strategic acquisition and milestone-priced consideration. Own the data, keep the contracts assignable, build the regulated position, and name the acquirer before you are asked.
Four Actions Next Quarter
1. Rebuild the investor list on fund math. Cut every name whose fund size makes your round uneconomic. Target twelve to fifteen who have led at your stage in your category in the past twelve months.
2. Write your Series A number. One figure: the recurring revenue, usage volume, or clinical readout that clears your category. Put the date you reach it directly next to it.
3. Rebuild the capital plan to thirty months. Burn to the proof milestone plus six months of process. If it does not fit, cut this quarter rather than next year.
4. Draft the acquirer thesis. Five operating companies, the product line each slots you into, and the capability each one cannot build in a year.
The record is being read as permission. It is a filter. The founders who understand the difference are already raising against a bar the rest of the market has not noticed moved.
Research Methodology and Sources
Data collection period: January 1 to June 30, 2026, with market data compiled through July 21, 2026. Every figure cited is attributed to the tracker that produced it, and figures from different trackers are not blended into combined totals.
Primary data sources: Crunchbase quarterly and half-year global funding reports, including the Q2 and H1 2026 global report, the seed graduation analysis published in May 2026, the Q2 billion-dollar exits analysis, the 2026 startup M&A analysis, and the H1 2026 fintech sector report. PitchBook and the PitchBook-NVCA Venture Monitor 2026 midyear report, reported through Fortune Term Sheet, for U.S. deployment, deal-size distribution, and exit value. Wellington Management’s 2026 midyear venture outlook for limited partner commitment concentration. Individual deal reporting from Crunchbase News for the XCures Series B.
Verification standard: Every deal-level figure was checked against the originating publication rather than an aggregator summary. Acquisition values that include milestone-contingent consideration are identified as maximums. Sector totals that vary materially across trackers, notably defense technology, are described directionally rather than as precise figures. Seed-stage data revises upward after the reporting period, so current-cohort graduation figures are treated as floors. Where a threshold reflects investor practice rather than a published dataset, notably the Series A revenue range, it is identified as such in the body text.
Excluded from analysis: Secondary transactions and tender offers, which reprice existing shares rather than deploying primary capital. Announced-but-unclosed rounds. Aggregator-only figures without corroboration in a company release or tier-one outlet.
DISCLAIMER: This article is for informational and strategic intelligence purposes only. It does not constitute investment advice. To assess your fundability, use The Eisen Fundability Score, a proprietary diagnostic within Fundables OS™.
If this article was useful, share it with founders who are about to raise.
— Leon Eisen, 4x Founder, Venture Capitalist, and Creator of Fundables OS™