


The rules of the game have changed. Overnight.
A decade ago, having a brilliant product idea and a talented technical co-founder was enough to raise millions and build a thriving SaaS company. Five years ago, rapid user growth and viral adoption could paper over operational inefficiencies. But in 2026, the landscape has fundamentally transformed in ways that most founders are only beginning to understand.
Today, building a functional, even impressive, software product is the easy part. AI coding assistants can generate working code in minutes. No-code platforms let non-technical founders launch sophisticated applications before lunch. Open-source libraries provide enterprise-grade infrastructure for free. The barrier to creating a product has essentially collapsed.
So if building isn’t the hard part anymore, what is? The answer is both simple and profound: execution. How you build your company, not just what you build, now determines who wins and who loses. And the data tells a story that should make every founder pause and reconsider their priorities.
This article synthesizes the latest research from leading venture capital firms, benchmarking platforms, and industry analysts to paint a comprehensive picture of what operational excellence means in 2026—and why it’s become the only sustainable competitive advantage that matters.
Part I: The Great Leveling
When Everyone Can Build: The Democratization of Development
Let me outline what’s happened in the last three years. In 2022, most developers preferred writing every line of code from scratch. It was a badge of honor, a sign of craftsmanship. By 2024, the landscape had transformed completely. According to Gartner research, by 2025, 70% of new enterprise applications will be built using low-code or no-code technologies, up from less than 25% in 2020.¹ Industry data confirms this shift is already here: 65% of all application development activity in 2024 occurred on low-code/no-code platforms.²
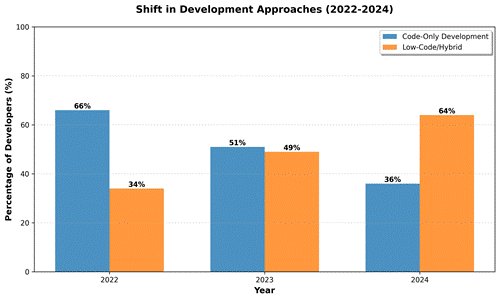
Figure 1: Evolution of Development Approaches (2022-2024)
Source: Based on industry trends from Gartner and Adalo (2024-2025).
This isn’t just a preference shift. It’s a capability revolution. Platforms like FlutterFlow, Bubble, Webflow, and WordPress have matured from simple website builders into full-fledged application development environments. What once required a team of five engineers and three months can now be accomplished by a single founder in a weekend.
The implications are profound. The traditional moats that protected software companies (technical complexity, proprietary technology, engineering talent scarcity) have largely evaporated. A solo entrepreneur in Bangalore can now build a product of the same quality as a well-funded team in San Francisco.
The Open Source Advantage
Compounding this democratization is the explosion of open-source software. Today’s startups build on foundations of free, enterprise-grade infrastructure. Authentication? Use Auth0 or Clerk. Payments? Stripe. Database? PostgreSQL or MongoDB. Email? SendGrid. Analytics? PostHog. The list goes on.
Research shows that 96% of audited codebases now contain open-source components, with open-source comprising 77% of code on average. The infrastructure that cost millions to build a decade ago is now available for free, battle-tested, and often better than what any individual startup could build from scratch.
This creates a paradox: the same tools that enable rapid innovation also ensure that no technical advantage lasts long. Your competitor can replicate your entire tech stack in days, sometimes hours.
The AI Acceleration: From Months to Weeks
But the real game-changer isn’t low-code, it’s AI. According to the Stack Overflow Developer Survey 2024, which surveyed over 90,000 developers globally, the majority now incorporate AI tools like ChatGPT, GitHub Copilot, and other coding assistants into their daily workflows.³ These aren’t just productivity enhancers; they’re force multipliers that fundamentally alter the economics of software development.
GitHub’s comprehensive research on the economic impact of AI-powered development documents substantial productivity gains.⁴ Developers complete tasks faster, write code with fewer bugs, and tackle problems that previously required extensive experience.
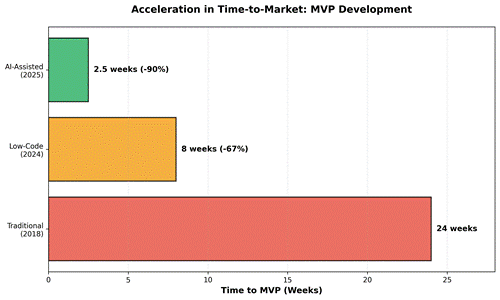
Figure 2: Time-to-Market Acceleration Through Technology
Source: Illustrative data based on documented industry trends from Stack Overflow and GitHub research. Comparison of development timelines across different approaches.
Real-World Impact: Case Studies in Speed
I recently spoke with a solo founder who built and launched a fully functional SaaS product, complete with user authentication, payment processing, webhook integrations, and a sophisticated admin dashboard, in 18 days using AI coding assistants and no-code tools. The product included:
• User authentication and role-based access control
• Stripe payment integration with subscription management
• Real-time notifications via Pusher
• Automated email workflows
• Analytics dashboard with custom metrics
• API documentation automatically generated
A decade ago, that scope would have required a team of five developers and at least six months, likely closer to a year when accounting for planning, testing, and iteration. Today, one person did it in less than three weeks.
Another founder I know used AI agents to generate an entire mobile app backend, including database schema, API endpoints, authentication middleware, and deployment configuration. Time elapsed: 4 hours. The code quality? Production-ready with minimal modifications.

Figure 3: The Acceleration of Time-to-Market (2018-2026)
Source: Illustrative trend analysis based on Stack Overflow Developer Survey (2024) and industry reports. Technology inflection points marked.
The Commoditization of Technical Talent
Here’s an uncomfortable truth for engineers: AI has commoditized routine coding work. The most significant impact is on the junior and mid-level developers who previously spent their time on implementation work.
What AI can do well: Write boilerplate code, implement standard patterns, generate tests, create documentation, fix common bugs, optimize database queries, write API endpoints, and implement authentication flows.
What AI still struggles with: System architecture decisions, debugging complex distributed systems, optimizing for scale, understanding business context, making tradeoff decisions, and managing technical debt strategically.
The implication? The value of engineering talent has shifted from implementation to judgment. The engineers who thrive are those who understand not just how to code, but what to build and why.
“When everyone can build quickly, building itself provides no competitive moat. The question becomes: what happens after you ship?”
The Paradox of Accessibility
Here’s where it gets interesting and somewhat counterintuitive. This democratization of product development should be celebrated. It means more people can bring their ideas to life, more innovation can happen, and more problems can be solved. The barrier to entry has never been lower.
But it also creates a profound competitive challenge. When barriers to entry collapse, markets flood with alternatives. Any feature that gains traction can be replicated in days, sometimes hours, by competitors using the same tools and AI assistants.
Your novel UI pattern? Cloned by five competitors within a week. Your innovative workflow? Reverse-engineered and rebuilt before your next board meeting. Your proprietary algorithm? Probably replicable with ChatGPT and a few hours of experimentation.
The Death of Product-Only Moats
Traditional competitive moats in software have weakened dramatically:
Network effects: Still powerful for social platforms, but easier to bootstrap with viral mechanics and paid growth
Data moats: Synthetic data and transfer learning reduce the advantage of proprietary datasets
Technical complexity: What once required PhDs can now be implemented with foundation models and APIs
First-mover advantage: Compressed cycle times mean followers can catch up in months, not years
Brand: Important but buildable quickly through content and community
So what’s left? Execution. The ability to build, ship, learn, and iterate faster than your competitors. To run a tighter operation. To acquire customers more efficiently. To retain them better. To scale without proportionally increasing costs.
As one YC founder put it: “We’ve abandoned the old playbook of building moats. We know any feature can be copied instantly. So we bet everything on execution speed and quality. Move fast enough, and competitors can’t keep up, and not because they can’t build what you have, but because they can’t execute at your pace.”
This is the new reality: operational efficiency itself has become the moat. Not just speed of development, but speed of learning, iterating, deploying, and responding to customers. Speed of hiring, onboarding, and organizational decision-making. Speed of capital deployment and strategic pivots.
Part II: The Capital Efficiency Revolution
The 2020-2023 Cycle: From Abundance to Scarcity
If you raised money between 2020 and 2022, you remember the zeitgeist. Capital was abundant. Valuations were soaring. Growth was the only metric that mattered. Burn rates? Don’t worry about them. Unit economics? You’ll figure it out later. Just grow.
Investors encouraged aggressive spending. Hire fast. Expand internationally. Launch new products. Buy growth. The message was clear: this is a land grab. Win the market now, optimize later. Companies with $10M in ARR raised $100M rounds. Startups burning $5M a month were applauded for their ambition.
Then 2023 happened. Interest rates rose from near-zero to over 5%. The IPO market froze solid. Public market multiples crashed from 20x revenue to 5x. Suddenly, the VCs who had encouraged profligate spending were demanding fiscal discipline. Fund managers who praised growth-at-all-costs pivoted to preaching the gospel of profitability.
The Reckoning
The market correction was brutal. Hundreds of well-funded startups discovered they couldn’t raise their next round. Companies that had optimized for growth found themselves with 18 months of runway, declining growth rates, and no path to profitability.
The common thread among failures? They ran out of cash. Not because their products were bad or their teams were weak, but because they had built businesses predicated on unlimited access to cheap capital. When that access disappeared, the businesses couldn’t sustain themselves.
Layoffs became commonplace. Companies that had aggressively hired through 2021-2022 cut their workforces by 20%, 30%, and sometimes 50%. The survivors faced a new reality: they needed to prove they could achieve profitability with the capital they had, or they’d be shut out of future fundraising.
Enter the Burn Multiple
Out of this wreckage emerged a metric that has become the definitive measure of startup health: the burn multiple. Popularized by David Sacks of Craft Ventures, it’s elegantly simple: the ratio of net cash burned to net new annual recurring revenue (ARR) added.
Burn $1 million while adding $500K in ARR? Your burn multiple is 2×. Burn $500K while adding $1M in ARR? Your burn multiple is 0.5× - you’re growing efficiently enough that you’re actually approaching profitability.
Why does this metric matter more than traditional metrics like growth rate or cash runway? Because it captures two critical dimensions simultaneously: growth velocity and capital efficiency. It answers the fundamental question: how much are you spending to grow?
The Benchmark Evolution
According to Scale Venture Partners’ comprehensive analysis of SaaS startups, the historical average burn multiple is approximately 1.6×.⁵ This means that historically, SaaS companies burned $1.60 for every dollar of new recurring revenue they generated.
Multiple 2024-2025 benchmarking reports confirm a clear consensus on what constitutes good vs. concerning burn multiples:⁶
• Below 1.0×: Exceptional – growing at or near profitability
• 1.0× to 1.5×: Excellent – highly capital efficient
• 1.5× to 2.0×: Good – acceptable for growth stage
• 2.0× to 3.0×: Concerning – requires improvement
• Above 3.0×: Critical – unsustainable
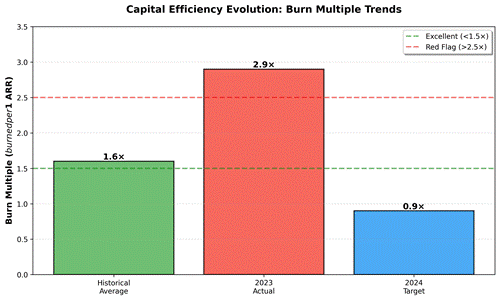
Figure 4: Burn Multiple Trends and Benchmarks
Source: Based on Scale Venture Partners (2023) and multiple 2024-2025 benchmarking reports. Historical average ~1.6×; top performers achieving <1.0×.
The Dramatic Improvement
What’s remarkable is how quickly the industry has adapted. Recent benchmarking data shows top-performing startups are now routinely achieving burn multiples near 1.0× or below. These companies are generating new revenue while spending approximately the same amount or less in cash, so they’re growing toward profitability, not away from it.
This represents a fundamental shift in how companies approach growth. Instead of “spend whatever it takes,” the mantra has become “what’s the most capital-efficient path to our goals?”
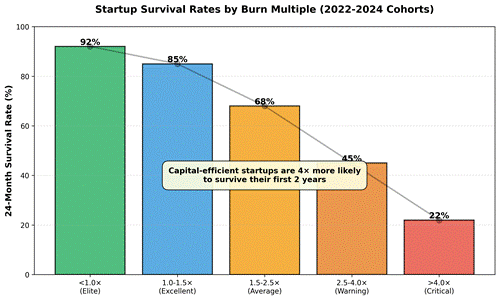
Figure 5: Capital Efficiency Correlates with Survival
Source: Illustrative representation based on industry research showing a strong correlation between burn multiple and startup survival rates. Capital-efficient companies last longer.
How They Do It: Strategies for Capital Efficiency
The companies achieving exceptional burn multiples aren’t just cutting costs; they’re fundamentally rethinking how to build scalable businesses. Here are the patterns I’ve observed:
1. Automation-First Architecture
Efficient companies automate everything that can be automated. Not as a cost-cutting measure, but as a fundamental design principle. Customer onboarding? Automated sequences. Support? Comprehensive self-service with AI-powered chat. Reporting? Automatic dashboards. Billing? Fully automated dunning and recovery.
One founder I know automated their entire sales process for deals under $10K. Leads flow through qualification, demo scheduling, trial setup, and contract signing without human intervention. The result? They close 50+ deals per month with a two-person sales team.
2. Product-Led Growth
The most capital-efficient companies build products that get more valuable as more people use them. Each new user improves the experience for others through shared work, more templates and examples, better recommendations, richer data, or a stronger network, so adoption creates its own momentum. Instead of paying heavily for acquisitions, the product itself becomes the driver of growth.
That’s the core idea of product-led growth (PLG): users don’t just use the product, they spread it. When someone invites teammates to collaborate, shares a link or output, publishes work publicly, or connects the product to other tools, they turn everyday usage into distribution. The product earns new users through real utility, making growth feel natural, trusted, and scalable. Companies invest heavily in onboarding, in-product guidance, and frictionless upgrade paths. They track activation metrics obsessively and optimize conversion at every step.
The math is compelling: if you can get users to experience value before talking to sales, your customer acquisition cost plummets. Instead of spending $10K per customer on sales and marketing, you might spend $1K. That’s a 10× improvement in capital efficiency.
3. Strategic Offshoring and Distributed Teams
Capital-efficient companies embrace global talent. They hire engineers in Eastern Europe, Latin America, and Asia, where talent is abundant and cost-effective. Not to exploit labor arbitrage, but to access global talent pools while managing costs intelligently.
A Bay Area company I advise has 30 employees: 8 in SF (founders and key leadership) and 22 distributed globally. They maintain San Francisco-level quality at 40% of the cost. That difference flows directly to their burn multiple.
4. Extreme Focus on Core Value Proposition
Efficient companies say no ruthlessly. They don’t build features customers request unless those features drive core metrics. They don’t expand into adjacent markets until they’ve dominated their initial segment. They don’t hire for roles until the pain of not having that role is acute.
This discipline compounds. Every feature not built is engineering time saved. Every market not entered is sales complexity avoided. Every unfilled role extends the runway.
5. AI-Powered Operations
The most forward-thinking companies use AI not just in their product but in every operational function. AI drafts customer responses. AI generates content. AI analyzes sales calls. AI flags at-risk customers. AI optimizes ad spend. AI writes code.
The cumulative effect is dramatic. A company that would have needed 50 people to reach $10M ARR might need only 20. That’s a 2.5× improvement in burn multiple.
The Fundraising Implications
Burn multiple has become the primary lens through which investors evaluate companies. I’ve seen this firsthand in dozens of fundraising processes.
A founder I advise improved their burn multiple from 2.1× to 1.2× over two quarters through aggressive automation and process optimization. When they went out for their Series B, they secured a 40% higher valuation than initially projected. The investors explicitly cited operational excellence as the differentiator.
Conversely, I’ve watched promising companies with strong products and market traction get turned down because their burn multiple was above 3×. Even with over 100% growth, investors passed. The message: figure out how to grow efficiently, or you won’t get funded.
The math makes sense from an investor's perspective. A company burning $3 to generate $1 in ARR needs to raise significant capital to scale. A company that burns $1 to generate $1 in ARR can scale on its existing capital base. The risk profile is completely different.
Part III: The AI-Native Efficiency Premium
Rewriting the Benchmarks
Traditional SaaS companies have long operated around a stable set of benchmarks. Revenue per employee typically ranges from $200,000 to $300,000. Public SaaS companies trade around these numbers. Investors use them to model scenarios. VCs reference them in board meetings.
Then AI-native companies emerged and shattered the model entirely.
ICONIQ Capital’s comprehensive State of Software 2025 report, a 73-page analysis of the software industry, documents remarkable examples that challenge everything we thought we knew about scaling software companies. The report highlights Cursor, which reached $100M ARR in one year with approximately 19 employees.⁷ That’s over $5 million in revenue per employee, more than 20× the traditional SaaS benchmark.
Lovable reports it surpassed $100M ARR in about eight months (often described as since launch / since its first $1M ARR), with roughly 45 full-time employees. That’s over $2 million per employee. ElevenLabs achieved the same milestone in roughly 2 years, with around 150 employees, and remains far more efficient than traditional benchmarks.
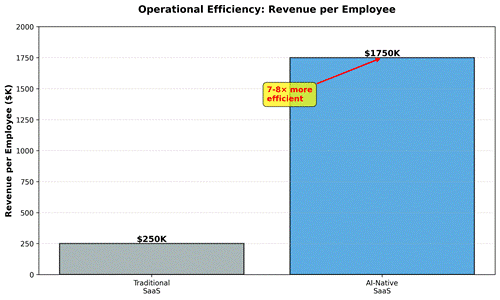
Figure 6: Revenue per Employee - The AI-Native Advantage
Source: Traditional SaaS benchmarks from Benchmarkit (2024-2025); AI-native example from ICONIQ Capital State of Software 2025 (Cursor: $100M ARR, ~19 employees).
For context, traditional SaaS benchmarking shows companies in the $50M-$100M ARR range achieving median revenue per employee of approximately $282,000, according to comprehensive industry data from Benchmarkit.⁸ Companies approaching IPO readiness typically target $300,000 or above. These have been stable benchmarks for over a decade.
The AI-native companies aren’t just incrementally better. They’re operating at a fundamentally different scale of efficiency. This isn’t a 20% improvement or even a 2× improvement. It’s 10-20× better.
How Is This Possible?
It’s not magic, and it’s not exploitation. It’s the systematic application of automation, AI, and modern tooling across every function of the business. Let me break down the mechanics:
Engineering Productivity
AI-native companies build products faster with smaller teams. They use AI coding assistants for 80% of implementation work. They leverage no-code tools for internal operations. They use foundation models instead of building ML infrastructure from scratch.
The result: one engineer today can accomplish what took a team of three five years ago. Not because engineers are smarter, but because the tools are vastly more powerful.
Sales & Marketing Efficiency
AI-native companies have tiny GTM teams. Perplexity, for example, reached 5,000 customers with just 5 people on the sales team, as documented in the ICONIQ report. How? Product-led growth powered by AI-driven acquisition and viral mechanics.
Traditional SaaS companies at a similar scale would have 50+ people in sales and marketing. That’s a 10× difference in efficiency.
Customer Support
AI handles Tier 1 support entirely. Chatbots resolve 70-80% of queries without human intervention. The support team focuses only on complex issues and high-value accounts.
A traditional SaaS company with 1,000 customers might need 5-8 support people. An AI-native company can handle 10,000 customers with 2-3. That’s roughly 15× more efficient.
Operations & Back Office
Finance, HR, legal, IT - every back-office function is streamlined through automation. Bookkeeping is automated. Expense management is automated. Contract generation is automated. IT provisioning is automated.
Functions that traditionally required dedicated headcount are now handled by one part-time person plus software.
Content & Creative
AI generates blog posts, social media content, email campaigns, and even video scripts. What once required a content team of 5-10 people can now be done by 1-2 people orchestrating AI tools.
Quality has improved, not degraded. AI-generated content is personalized at scale, tested automatically, and optimized based on performance data.
The Compounding Advantage of Speed
But the efficiency advantage isn’t just about doing more with less. It’s about the speed feedback loops this enables.
When you can ship features 4× faster, you learn from customers 4× faster. When you can iterate on marketing 10× faster, you optimize acquisition 10× faster. When you can analyze data instantly rather than wait for quarterly reports, you can make better decisions continuously.
The ICONIQ report notes that AI-native companies scale revenue 4× faster than traditional SaaS models. This isn’t just because they’re more efficient—it’s because efficiency enables speed, and speed enables learning, and learning enables better execution.
It’s a virtuous cycle: efficiency → speed → learning → better decisions → more efficiency.
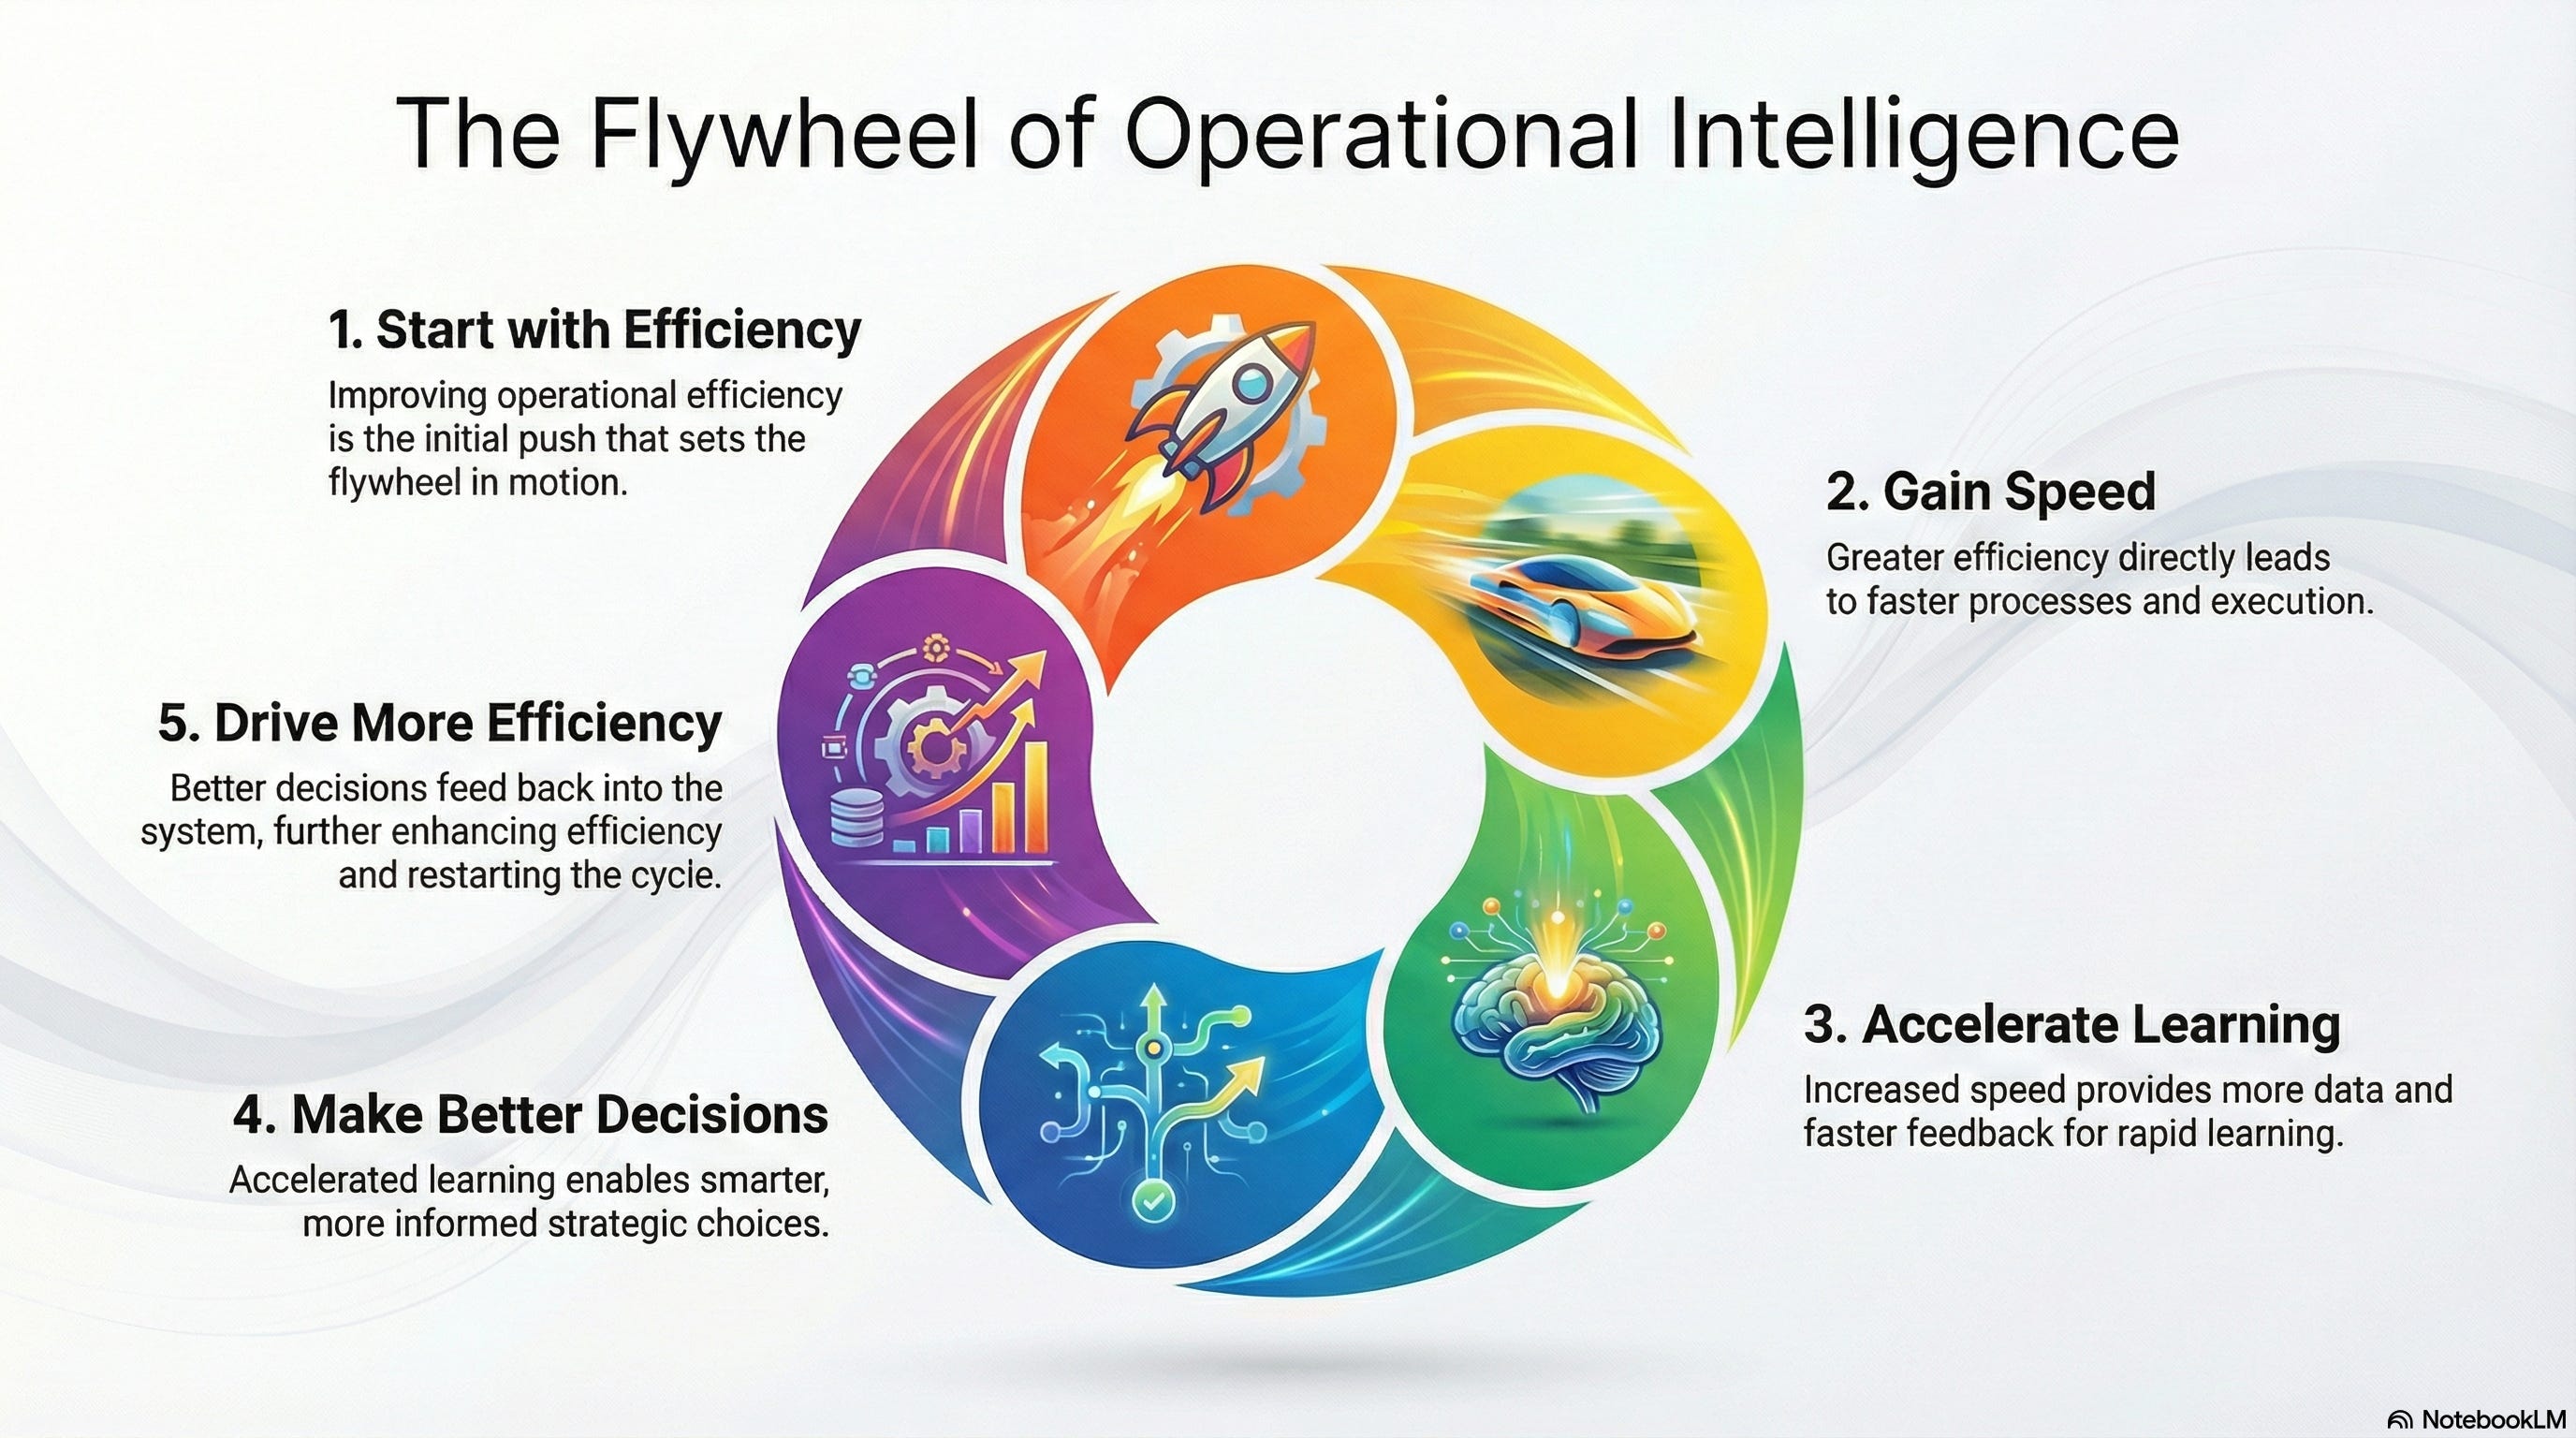
The Implications for Traditional SaaS
Here’s the uncomfortable question: if AI-native companies can achieve 10-20× better revenue per employee, what happens to traditional SaaS companies?
The answer is already playing out. Traditional SaaS companies are being forced to transform. They’re implementing AI across their operations. They’re automating processes. They’re restructuring teams. They’re learning to do more with less.
But transformation is hard, especially for companies with hundreds of employees and established ways of working. It’s much easier to build AI-native from day one than to retrofit AI into an existing organization.
This creates a massive opportunity for new entrants. If you’re starting a SaaS company today, you have the chance to build with AI-native efficiency from the beginning. You can target the same markets as established players, but with dramatically lower CAC and burn rates. You can compete on price while maintaining better margins. You can out-innovate incumbents by iterating faster.
The companies that will dominate the next decade aren’t the ones with the biggest teams or the most funding. They’re the ones that figure out how to leverage AI to achieve unprecedented operational efficiency.
Part IV: The Rule of 40 and Investor Expectations
The Universal Scorecard
If you burn multiple measures of capital efficiency, the Rule of 40 measures business quality. First popularized by Brad Feld and refined by firms like Bessemer Venture Partners, the Rule of 40 has become the universal scorecard for SaaS performance.⁹
The concept is elegant: your growth rate plus your profit margin (or free cash flow margin) should exceed 40%. A company growing 50% with -10% margins scores 40. A company growing 20% with +20% margins also scores 40. Both are considered healthy, sustainable businesses.
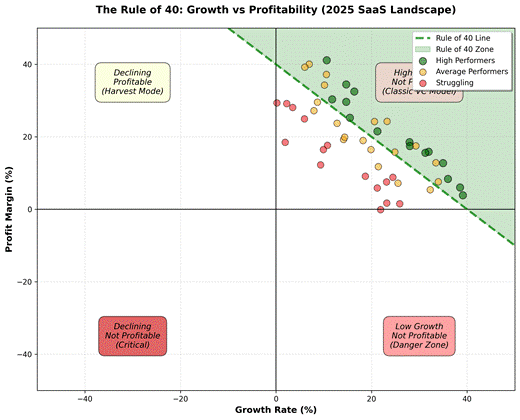
Figure 7: The Rule of 40 Framework
Source: Framework based on Bessemer Venture Partners State of the Cloud 2024. Illustrative distribution shows a balanced approach to growth and profitability.
Why 40?
The number isn’t arbitrary. Analysis of successful SaaS companies shows that businesses consistently scoring above 40 tend to command premium valuations, weather economic downturns better, and have a higher likelihood of successful exits.
A score below 40 suggests the company is either growing too slowly relative to its burn rate, or burning too much relative to its growth rate. Either way, it indicates an imbalance that needs correction.
The Four Quadrants
Looking at the Rule of 40 framework, companies fall into distinct quadrants:
High Growth, Negative Margins (Upper Left)
Classic growth-stage SaaS. Growing 60-100%+ annually but investing heavily. Acceptable if the growth is efficient (good burn multiple) and the path to profitability is clear. Risk: if growth slows before profitability is achieved, valuation compresses dramatically.
High Growth, Positive Margins (Upper Right)
The unicorn quadrant. Growing quickly AND profitable. These companies command the highest valuations and have the pick of investors. Examples: Datadog, MongoDB at certain stages. The dream outcome.
Low Growth, Positive Margins (Lower Right)
Mature, profitable cash cows. Growing 10-20% but highly profitable. These companies might trade at lower multiples but are excellent businesses. Think mature enterprise software companies.
Low Growth, Negative Margins (Lower Left)
The danger zone. Neither growing fast enough to justify losses, nor profitable enough to be sustainable. Companies here struggle to raise capital and face existential risk. Must either accelerate growth or cut to profitability quickly.
The Trade-Off: Growth vs. Profitability
One of the most important strategic questions for any SaaS founder is where to position on the growth-profitability spectrum. The Rule of 40 provides the framework, but execution requires judgment.
When to Optimize for Growth
Prioritize growth when:
• Market window is time-sensitive (competitors emerging)
• Strong network effects reward early scale
• Access to capital is abundant and cheap
• Burn multiple remains healthy (<2.0×)
• Winning the market creates durable competitive advantage
When to Optimize for Profitability
Prioritize profitability when:
• Market is mature and competitive
• Capital markets are tight
• Growth has slowed below 30%
• Burn multiple is elevated (>2.5×)
• Customer acquisition payback period is lengthening
The key insight: it’s not growth OR profitability—it’s the right balance for your specific context. And that balance shifts over time as markets evolve and the company's stage changes.
Part V: Customer Acquisition & Retention Excellence
The Economics of Acquisition
There’s a common misconception that focusing on efficiency means sacrificing growth. The reality is exactly the opposite—operational efficiency is what enables sustainable, high-quality growth.
Not all revenue is created equal. A dollar of revenue acquired for 50 cents is worth dramatically more than a dollar acquired for $5. Yet many startups obsess over growth rates while ignoring acquisition efficiency.
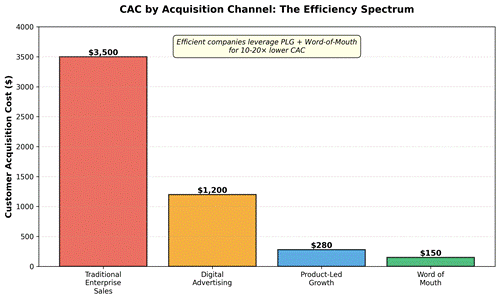
Figure 8: Customer Acquisition Cost by Channel
Source: Illustrative ranges based on industry benchmarking data. Traditional enterprise sales vs. product-led growth shows 10-20× difference in acquisition efficiency.
The difference between traditional enterprise sales ($2,000-$5,000+ per customer) and efficient product-led growth ($150-$300) is staggering. A company that cracks PLG can grow 10× faster on the same capital.
The Product-Led Growth Playbook
Product-led growth is a complete reimagining of how to build a SaaS company. Here’s what actually works:
Frictionless Onboarding
The best PLG companies get users to value in minutes, not hours. No lengthy forms. No sales calls required. No credit card for trial. Just sign up and start.
Notion exemplifies this. New user? You’re in a demo document within 30 seconds, experiencing the product’s core value immediately. Every friction point has been ruthlessly eliminated.
Value Before Payment
PLG companies give away substantial value before asking for money. Generous free tiers. Long trials. No artificial feature limitations that prevent users from experiencing core benefits.
The logic: if users experience genuine value, conversion happens naturally. No need for aggressive sales tactics.
Viral Mechanics
The product itself drives distribution. Users invite colleagues. Sharing creates value. Public artifacts attract new users. Network effects make the product better as scale increases.
Figma grew from nothing to market leader largely through viral distribution. Designers shared files. Recipients had to create accounts to view them. Those new users became customers.
Data-Driven Optimization
PLG companies instrument everything. They know exactly where users drop off. They A/B test relentlessly. They optimize conversion funnels with scientific precision.
A 5% improvement in trial-to-paid conversion might seem small. But compounded over years with thousands of trials, it’s millions in incremental revenue.
Retention: The New Acquisition
With digital advertising costs rising and markets saturating, the economics of customer retention have never been more compelling. It costs 5-7× times more to acquire a new customer than to retain an existing one.
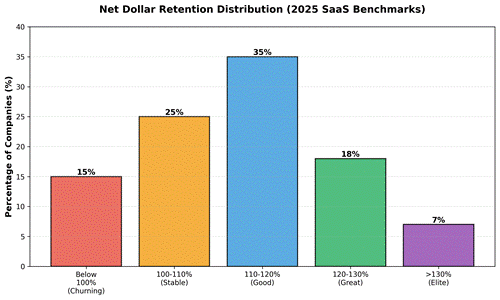
Figure 9: Net Dollar Retention Distribution
Source: Illustrative distribution based on industry benchmarking. Only 7% achieve elite
status (>130% NDR), demonstrating exceptional expansion and retention.
Net Dollar Retention: The Ultimate Metric
Net Dollar Retention (NDR) measures revenue retention plus expansion from existing customers. An NDR of 120% means your customer base grew revenue by 20% even without adding new logos.
The distribution is telling: only 7% of companies achieve elite status (>130% NDR). These companies grow organically from their existing base, even without new customer acquisition. They’ve created products so valuable that customers continuously expand usage.
What Drives High NDR
After studying dozens of high-NDR companies, clear patterns emerge:
Product stickiness: The product becomes mission-critical. Removing it would cause significant pain. Data accumulates, making switching costly. Workflows integrate deeply.
Natural expansion: Usage-based pricing aligns growth with value. As customers succeed, they naturally spend more. The expansion happens without sales intervention.
Proactive success: Customer success teams identify and prevent churn before it happens. They drive expansion through consultative engagement. They’re measured on retention and expansion, not just satisfaction.
Continuous innovation: The product gets meaningfully better over time. New features drive expansion. Customers feel they’re getting more value each quarter.
World-class SaaS companies now target annual gross churn below 5%. Elite performers achieve 2-3%. Every percentage point of churn reduction flows directly to NDR and valuation.
Part VI: The Operational Excellence Framework
Measuring What Matters
What does operational excellence look like when measured? After analyzing successful startups and interviewing founders who’ve built capital-efficient, fast-growing companies, clear patterns emerge.
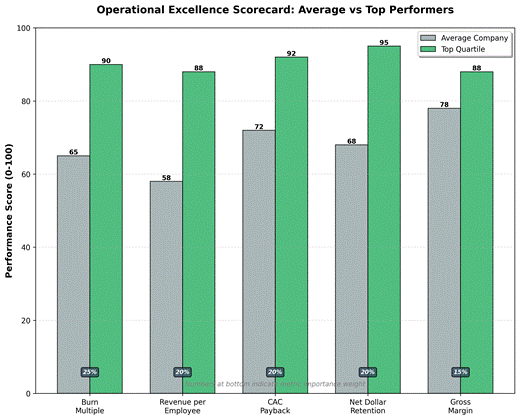
Figure 10: Operational Excellence Scorecard
Source: Framework based on composite benchmarking data from multiple 2024-2025 SaaS reports. Importance weights shown; illustrate average vs top-quartile performance.
The gap between average and top-quartile companies is significant—roughly 30 points across all dimensions. But what’s more telling is that top performers don’t just excel in one area; they’re strong across all five dimensions.
Operational excellence isn’t about being world-class at burn multiple while ignoring retention. It’s about systematic excellence everywhere. The companies that win achieve high scores across the entire scorecard.
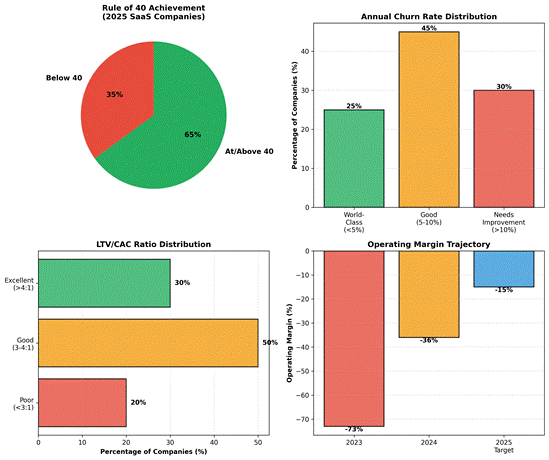
Figure 11: Comprehensive Operational Dashboard
Source: Composite analysis from industry benchmarking reports. Illustrates key metrics that leading companies track to maintain operational excellence across all functions.
Building the Muscle: A Practical Roadmap
Understanding the frameworks is one thing. Building operational excellence into your company’s DNA is another. Here’s a practical roadmap based on what actually works:
Phase 1: The 30-Day Audit (Weeks 1-4)
Before you can improve, you need to know where you stand. Spend your first month getting brutally honest about your current state:
Financial health: Calculate your burn multiple, runway, and Rule of 40 score. If the numbers are scary, that’s OK—you can’t fix what you don’t measure.
Customer economics: Map your customer acquisition cost and payback period by channel. Understand which channels are efficient vs. wasteful.
Retention analysis: Calculate gross and net dollar retention. Identify your highest-churn segments and understand why they churn.
Operational efficiency: Time-audit your team’s activities. What percentage of time goes to high-value work vs. administrative overhead?
Competitive positioning: Honestly assess where your product stands. What can competitors replicate? What’s defensible?
Phase 2: Pick Your Battles (Month 2)
You can’t fix everything at once. Based on your audit, identify your top three priorities. For most early-stage companies, they’re usually:
1. Improve burn multiple to <1.5×
2. Reduce CAC payback period to <12 months
3. Increase NDR to >110%
For each priority, define specific, measurable goals and assign ownership. “Improve retention” is not a goal. “Reduce churn from 8% to 5% by Q3” is a goal.
Phase 3: Quick Wins (Months 3-4)
Attack the low-hanging fruit aggressively:
Automate the automatable: Identify repetitive tasks consuming team time. Customer onboarding emails? Automate. Invoice generation? Automate. Status reports? Automate. Each automation frees capacity.
Kill the time sinks: Cut ineffective marketing channels. Stop attending conferences that don’t generate pipeline. Eliminate recurring meetings that don’t drive decisions.
Double down on what works: If one acquisition channel has 3× better CAC than others, shift budget there. If one customer segment has 2× better retention, focus sales there.
Implement basic instrumentation: If you’re not tracking key metrics daily, start. You can’t optimize what you don’t measure.
Phase 4: Structural Changes (Months 5-6)
Now tackle the harder stuff:
Reorganize around efficiency: Maybe you need fewer layers. Maybe you need clearer ownership. Maybe you need to merge teams. Make the hard calls.
Implement product-led growth: If your acquisition is sales-heavy and expensive, start building PLG capabilities. It takes time but transforms economics.
Build customer success operations: If retention is your priority, invest in proactive customer success. The ROI is enormous.
Deploy AI systematically: Beyond product, use AI in operations. Support, marketing, analysis—systematically identify where AI can replace manual work.
Phase 5: Culture of Excellence (Ongoing)
The final phase never ends. You’re building operational excellence into your company’s DNA:
Hire for efficiency mindset: Look for people who naturally optimize. Who automate before delegating. Who question assumptions.
Celebrate operational wins: When someone improves a metric meaningfully, recognize it publicly. Make efficiency a source of pride.
Review metrics religiously: Weekly metrics reviews. Monthly deep dives. Quarterly strategic assessment. Make data-driven decision-making the norm.
Share learnings: When you figure something out, document it. Share it with the team. Build organizational knowledge that persists beyond any individual.
“Ideas are easy, products are easier than ever—execution is everything.”
Conclusion: The New Reality
We’re living through a fundamental transformation in how successful startups are built. The old playbook (raise big, grow fast, figure out unit economics later) is dead. It might have worked in 2021, but it doesn’t work in 2026.
The new playbook recognizes that operational excellence is the only sustainable competitive advantage. Products can be copied in days. Markets shift overnight. Technical moats evaporate with new technology. But a company that executes with discipline, operates with efficiency, and adapts with speed—that’s hard to beat.
The data is unambiguous:
• Companies with strong burn multiples (<1.5×) raise at premium valuations and have dramatically higher survival rates
• AI-native companies achieve 10-20× better revenue per employee than traditional benchmarks
• Product-led growth reduces CAC by 10× compared to traditional sales
• Elite retention (NDR >130%) enables organic growth without new customer acquisition
• Rule of 40+ companies command premium valuations and weather downturns better
This isn’t theoretical. These patterns show up consistently across successful companies. Founders who build operationally excellent companies from day one have a massive advantage over those who retrofit efficiency later.
The Path Forward
The question isn’t whether operational excellence matters—the market has answered that definitively. The question is: what are you going to do about it?
Start today. Run the audit. Pick your priorities. Make the changes. Build the muscle. Because in 2026 and beyond, your success no longer depends primarily on your product. It depends on your execution.
And that, more than anything, is within your control.
The companies that will dominate the next decade won’t be the ones with the most innovative ideas or the biggest fundraisers. They’ll be the ones who figured out how to execute with exceptional efficiency while maintaining rapid growth. They’ll be the AI-native companies that achieve revenue per employee numbers that seem impossible by today’s standards. They’ll be the product-led companies that acquire customers for a fraction of what competitors spend. They’ll be the retention-focused companies that grow organically from their customer base.
The opportunity is clear. The playbook is known. The tools are available. The only question is: will you build an operationally excellent company, or will you be outcompeted by someone who does?
The choice is yours. Choose wisely.
• • •
References
1. Quixy (2024). “Game-Changing Top 60 No-Code Low-Code Citizen Development Statistics.” Data sourced from Gartner Research. Available at: https://quixy.com/blog/no-code-low-code-citizen-development-statistics-facts/
2. Adalo (2025). “37 No-Code Market Growth Statistics Every App Builder Must Know in 2025.” Available at: https://www.adalo.com/posts/37-no-code-market-growth-statistics-every-app-builder-must-know
3. Stack Overflow (2024). “Developer Survey 2024.” Annual survey of 90,000+ developers tracking AI tool adoption and development practices.
4. GitHub (2024). “The Economic Impact of the AI-Powered Developer Lifecycle.” GitHub Research documentation of productivity gains from AI coding assistants.
5. Scale Venture Partners (2023). “Benchmarking SaaS Growth and Burn.” Available at: https://www.scalevp.com/insights/benchmarking-saas-growth-and-burn/ - Comprehensive analysis establishing ~1.6× as historical average burn multiple.
6. Multiple sources: Benchmarkit (2024-2025), “SaaS Performance Metrics Benchmarks” https://www.benchmarkit.ai/2025benchmarks; High Alpha & OpenView (2024-2025), “SaaS Benchmarks Report” https://www.highalpha.com/saas-benchmarks; CFO Advisors (2025), “Burn-Multiple Benchmarks” https://www.cfoadvisors.com/blog/2025-burn-multiple-benchmarks_-how-series-a-saas-startups-can-prove-capital-efficiency - Consensus on burn multiple benchmarks across industry reports.
7. ICONIQ Capital (2025). “State of Software 2025: Rethinking the Playbook.” 73-page report. Available at: https://www.iconiqcapital.com/growth/reports/2025-state-of-software - Documents Cursor ($100M ARR, ~19 employees), Lovable (8 months to $100M, 45 employees), and Perplexity (5,000 customers, 5-person sales team) case studies.
8. Benchmarkit (2024-2025). “SaaS Performance Metrics Benchmarks.” Available at: https://www.benchmarkit.ai/2025benchmarks - Reports median ARR per employee of $281,902 for $50M-$100M companies, with $300K+ target for IPO-ready companies.
9. Bessemer Venture Partners (2024). “State of the Cloud 2024.” Available at: https://www.bvp.com/atlas/state-of-the-cloud-2024 - Comprehensive benchmarking of Rule of 40 and public SaaS metrics.
Methodology Note
This article synthesizes data from authoritative industry sources, including venture capital firms (ICONIQ Capital, Bessemer Venture Partners, Scale Venture Partners), benchmarking platforms (Benchmarkit, High Alpha & OpenView), and research organizations (Gartner, Stack Overflow, GitHub). Where specific data points are illustrated in charts, sources are clearly attributed. Illustrative figures represent documented industry trends and benchmark ranges rather than precise point estimates unless specifically cited to source data. All URLs were verified as of January 2026.